Attendance Video
Attendance data
Improve your Student Information System (SIS) capabilities by connecting it to our dashboard system for attendance analysis. Our comprehensive dashboard system enables large and small school districts to efficiently monitor student attendance and analyze trends based on district, region, school, grade level, or any available demographic variable. Our system is highly compatible and there are no known technical limitations between our dashboard system and any SIS.
HISTORICAL DATA
We understand that historical data analysis is crucial for school districts, and our dashboard system allows for deep analysis without interrupting the analytic flow of the end user. With our system, historical data is readily available and can be accessed by the end user with a single click. This allows for a more complete understanding of student attendance patterns and trends, empowering schools to provide better support for their students.
Our system has received positive feedback from clients, who have reported significant improvements in their ability to support their students based on a more complete understanding of their attendance patterns. With our system, school districts can unlock the full potential of their SIS and make more informed decisions based on historical and current data.
granular and aggregate
Our dashboard system offers robust granular and aggregate attendance data analysis capabilities, enabling school districts to conduct detailed analysis of attendance patterns. To achieve this, we leverage automated data export processes that transfer granular attendance data from the SIS to our dashboard system each night.
This granular data is then used to aggregate attendance data by various dimensions such as district, school, grade level, gender, ethnicity, race, economic status, SPED status, ELL status, and other available demographic variables. Additionally, our system provides dis-aggregation capabilities that allow for the analysis of attendance data at the individual student level, enabling administrators to gain insights into specific students' attendance patterns.
To ensure the relevance and usefulness of the data, we develop custom logic to visually identify data points that require attention based on district-defined thresholds. For example, we can set up our system to display warning colors for attendance data that falls below a certain threshold, enabling administrators to quickly identify areas that require improvement.
Our system is highly scalable, capable of processing large volumes of attendance data, ranging from tens of thousands to over 40 million rows, with fully automated processes that update the dashboard system each day. Overall, our granular and aggregate attendance data analysis capabilities provide school districts with the insights they need to make informed decisions and take proactive measures to support student success.
Attendance Dashboard Example
In this example, we have selected the month of February, which triggers the dashboard system to display attendance data for that month broken down by grade level. By clicking on a specific grade level, the dashboard system then reveals the names of students in that grade along with their corresponding attendance information for the selected time period. This allows school and district administrators to quickly drill down to the individual student level and gain insights into specific attendance patterns.

Features
Allows for ongoing attendance monitoring
Compares point-in-time historical attendance comparisons (YTD or any week)
Allows for dynamic sub-group attendance monitoring with few clicks
Color coding used to read warning levels at a glance
Allows for easy to read grade level attendance analysis
Drills down to individual students
Filters down to groups of students in need of attendance improvement
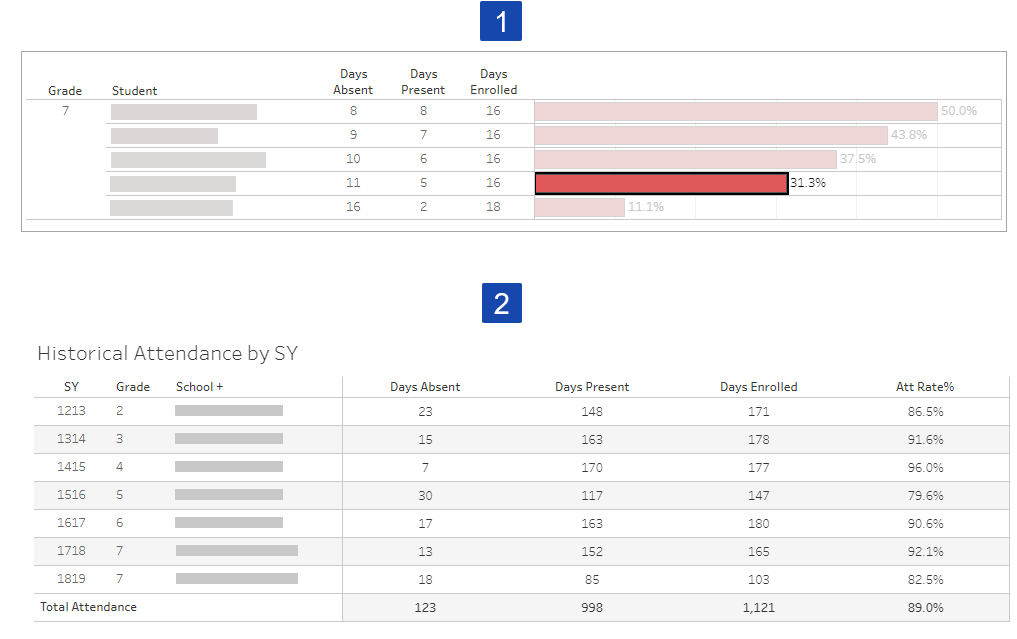
Historical Analysis
When analyzing current attendance data for a student, access to their historical attendance information is just a click away. The first step involves reviewing the student's attendance data for any point in time within the current school year. With a single click, the second step is executed and the dashboard system displays the student's historical attendance records, allowing for deeper analysis and a more complete understanding of attendance patterns.